Measurement
Influencer Marketing KPIs: The 12 Metrics That Change a Decision
 Kaan Gural · Nov 12, 2026

Influencer marketing KPIs tend to accumulate rather than get chosen. Every platform adds a metric, every stakeholder asks for one more column and by the end of the year the report is long enough that nobody reads past the first screen.
That gap between what gets tracked and what gets acted on is the problem worth solving. Reporting more does not make a program easier to defend and it does not make the next campaign better. What does both is deciding in advance which numbers you have agreed to act on and what you will do when they move.
This guide covers twelve influencer marketing KPIs, each with its formula and the decision it is there to support. They are grouped by when that decision gets made rather than by where they sit in the funnel, because a number that arrives after the budget is spent cannot change how the budget was spent.
Key takeaways
- Influencer marketing KPIs are the few metrics you set a target for before a campaign launches and act on once it runs: which creators to rebook, where to move budget mid-flight and whether the program gets funded again. Twelve are worth tracking, grouped by when that decision gets made.
- Before you commit budget: engagement rate, CPM, audience overlap rate, relevant reach.
- While the campaign is live: frequency, campaign engagement rate, click-through rate, cost per engagement.
- After the campaign closes: conversion rate, cost per acquisition, return on investment, content asset value.
- The selection rule: every campaign needs one primary KPI that determines success, plus two or three diagnostics that explain why it succeeded or failed.
What are influencer marketing KPIs?
Influencer marketing KPIs should be the metrics a team commits to before a campaign launches, each attached to a target and to a specific action that follows if the target is missed or beaten, which is what separates them from the wider set of numbers a platform reports.
Everything else your platforms report is a metric. It is useful and often interesting, but it is not something anyone has agreed to act on.
Why are influencer marketing KPIs important?
Without KPIs agreed in advance, budget gets spread evenly instead of moved, because nothing tells you which creator is outperforming while the campaign is live. The post-campaign conversation then turns into interpretation, because success was never defined.
They are also what make an influencer budget defensible. Finance is asking what the money returned and how you know, and a number agreed before the spend beats one chosen afterwards because it looks favorable.
How to choose influencer marketing KPIs
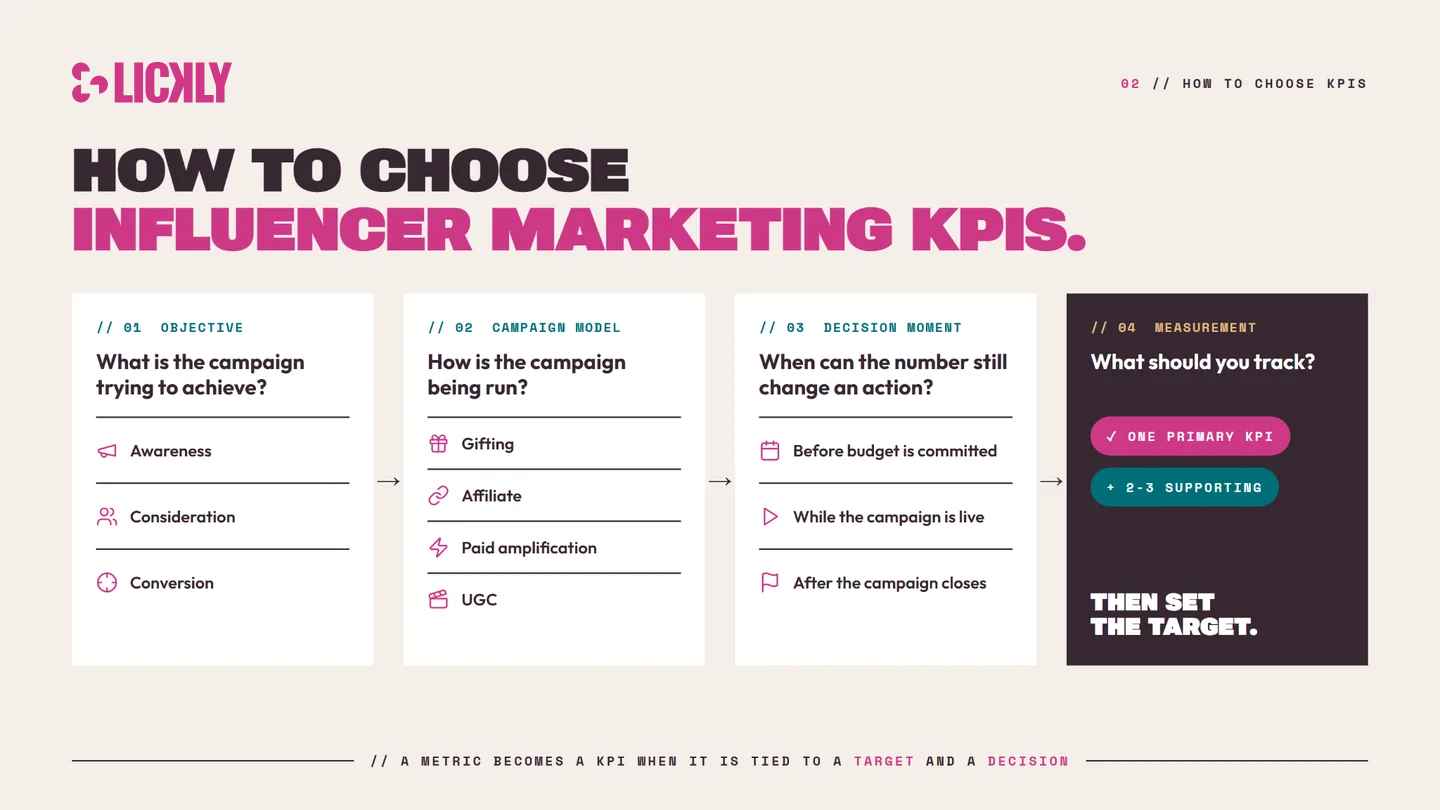
Start with three questions: what is the campaign trying to achieve, how is the campaign being run, and when will the metric be used to make a decision?
The campaign objective tells you what success should look like. An awareness campaign may prioritize relevant reach, while a direct-response campaign may focus on cost per acquisition or ROI. The campaign model then affects what you can realistically measure. A gifting campaign, an affiliate program and a paid whitelisting campaign can share the same objective, but the available data and the right KPI will not always be the same.
Timing matters too. A KPI is most useful when it can still change an action. Before launch, it may help you choose creators, compare fees or avoid audience overlap. While the campaign is live, it may help you move budget, amplify stronger content or adjust a weak call to action. After the campaign ends, it should help you decide what to repeat, stop or fund again.
A simple rule is to choose one primary KPI for each campaign, plus two or three supporting metrics. The primary KPI tells you whether the campaign succeeded. The supporting metrics explain why it performed the way it did.
The 12 influencer marketing KPIs worth tracking
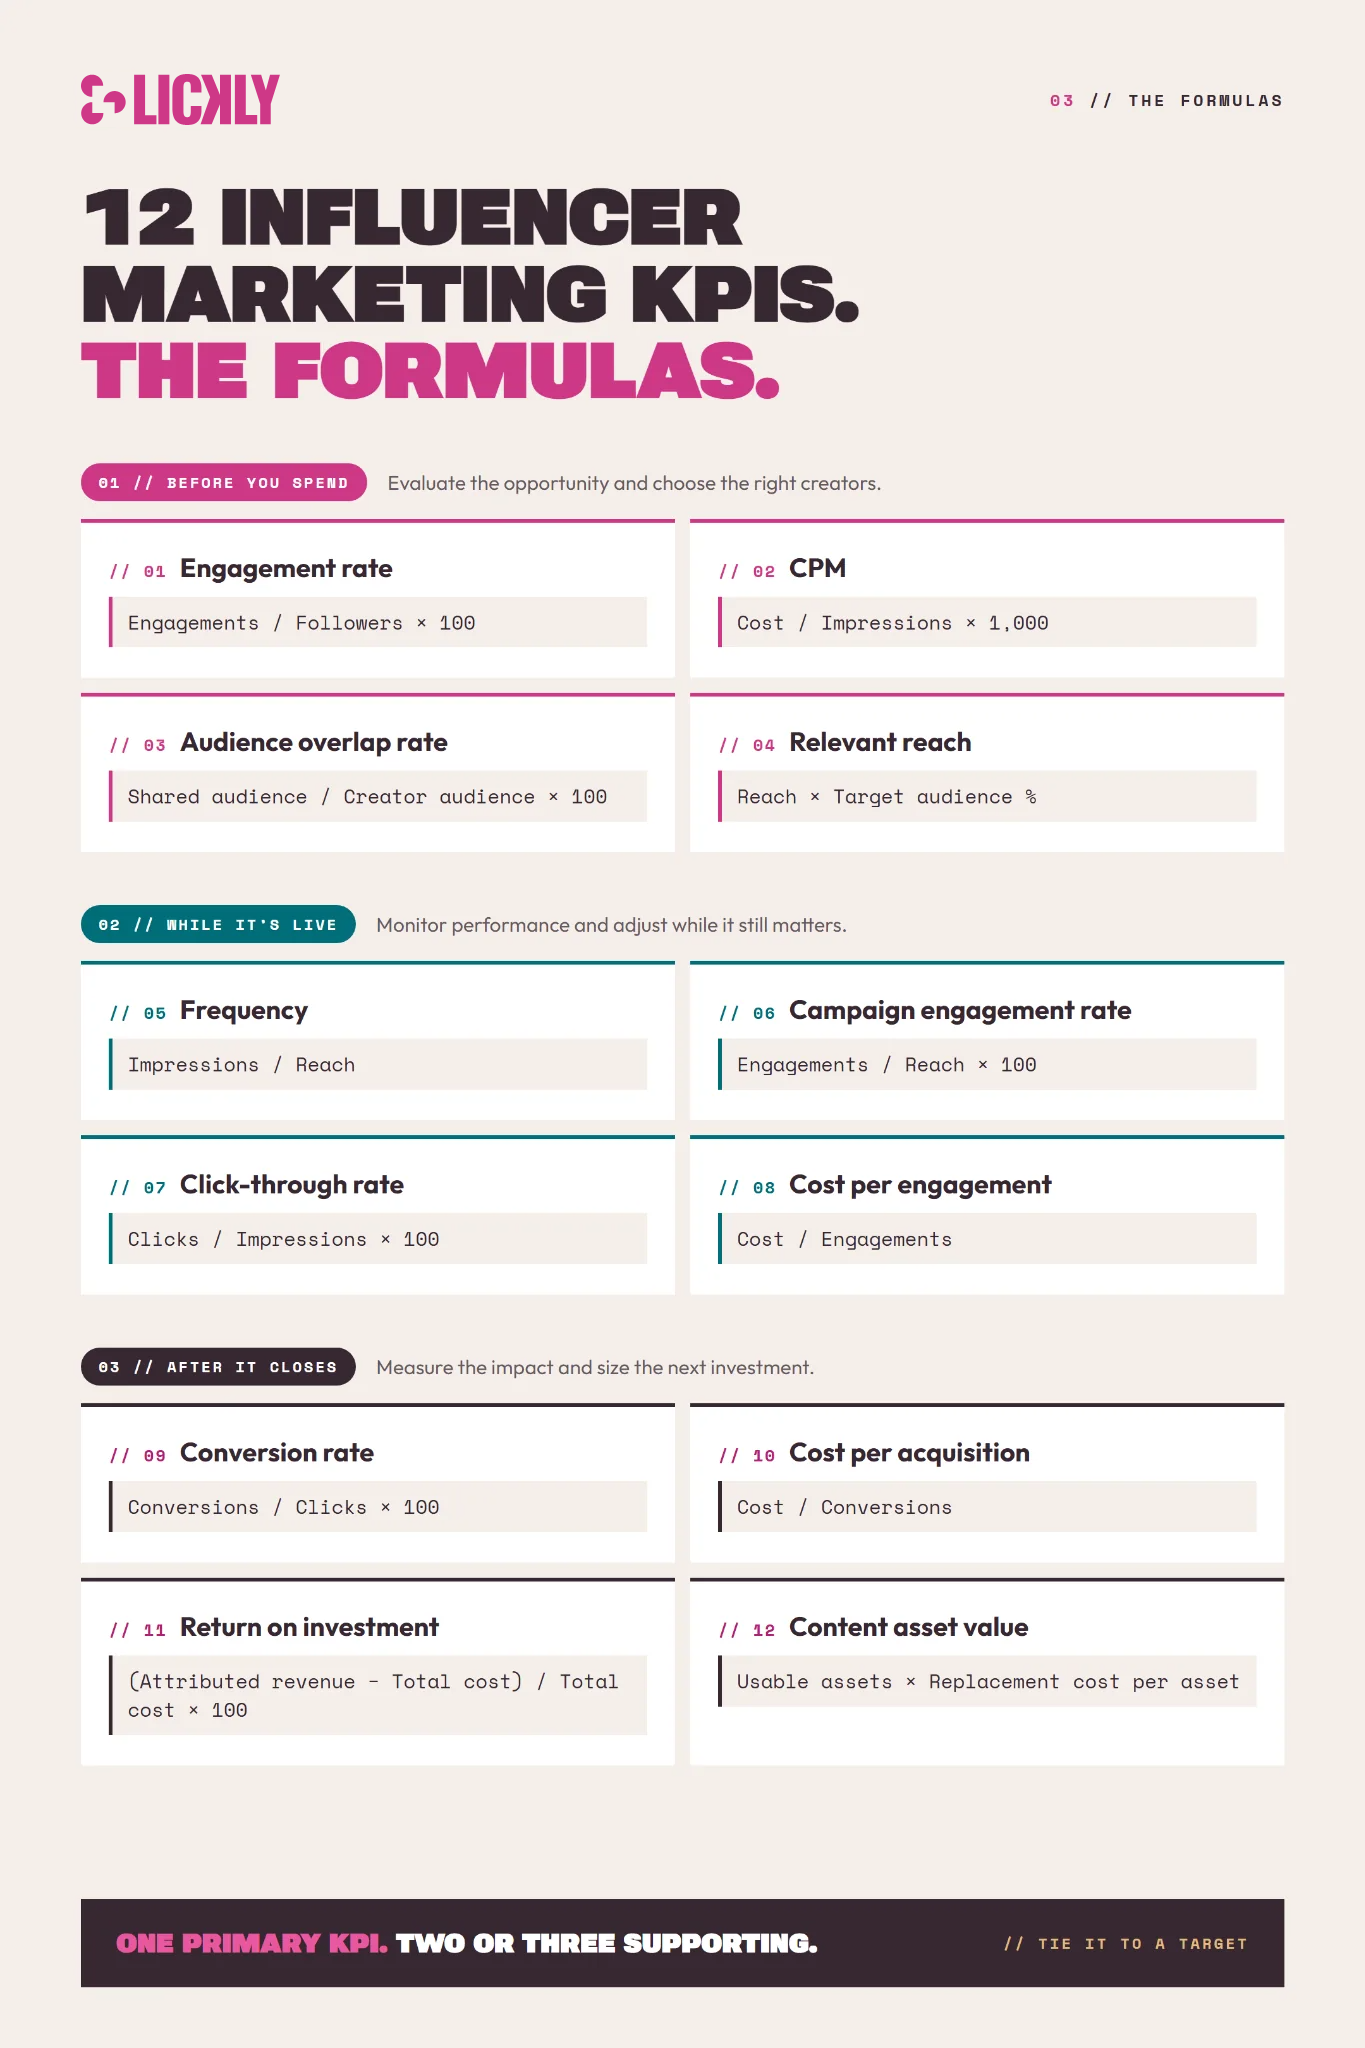
These twelve influencer marketing KPIs are grouped by when each one can still change a decision: before you commit budget, while the campaign is live and after it closes. Every entry gives the formula, how to read it and the decision it supports.
Before you commit budget
These four are the only KPIs on the list you can act on before any money moves.
1. Engagement rate
Engagement rate tells you what share of a creator's audience responds to their content. At this stage you are using it to vet, not to report.
Engagement rate = Total engagements / Followers × 100
Engagements are the deliberate actions someone takes on a post, such as likes, comments, shares and saves. Some tools widen that definition to include profile visits, sticker taps or video views, which can make creators look stronger simply because more actions are being counted. Agree on what counts as an engagement before you compare creators.
Saves and shares can indicate deeper engagement than a like, so it is worth looking at the mix of actions rather than the total engagement rate alone.
Published benchmarks are less useful than they look because they often use different denominators and different definitions of engagement. Hold your own definition constant and compare each creator against their own recent median.
Decides whether a creator makes the shortlist.
2. CPM
CPM tells you what you pay for every 1,000 impressions, and it is the fastest way to test whether a fee is defensible before you sign.
CPM = Total cost / Impressions × 1,000
Before a campaign you are working from the creator's own estimate, so build it from the impressions on their recent comparable posts. If a creator will only share reach, what you have is cost per 1,000 people reached, a different and usually higher number. Label it that way rather than calling it CPM, because mixing the two will distort the shortlist.
Run it across every creator and the outliers appear immediately. Someone asking three times the CPM of a comparable creator needs a reason, and often there is one: better audience fit, stronger content, usage rights included. The point is to make yourself name it.
Decides what to pay and what to negotiate.
3. Audience overlap rate
Audience overlap rate is the share of a creator's audience you have already paid to reach through other creators in the same period. Saturation is what happens when that share gets high enough that your fifth creator is mostly reaching people who saw the first four.
Audience overlap rate = Followers shared with creators already booked / Creator's total followers × 100
You will rarely get a clean number, because it depends on what audience data you can access. Where you cannot calculate it directly, compare audience and interest profiles across the shortlist and flag the pairs that look close.
Many teams cannot see overlap at all, because their tools are built around creator search, which assesses every profile on its own terms. Lickly starts from the audience you want to reach and maps creators to it, so overlap is visible across the shortlist while you are still choosing, not discovered afterwards when the reach has already been paid for twice.
Decides how many creators to book, and which to cut from a shortlist that looks strong one name at a time.
4. Relevant reach
Relevant reach is the portion of a creator's audience that matches your buyer. Raw reach counts everyone.
Relevant reach = Estimated reach × % of audience matching your target segment
Match on what you can verify, usually geography, age band and category interest. A creator with 80,000 followers where 20% are in your market gives you 16,000 relevant reach, which can easily be worse than a creator with 25,000 followers where 70% match.
Decides which creator wins when two look similar on paper. The audience breakdown comes from the creator's insights, so make it a standard ask in your outreach message rather than something you chase later.
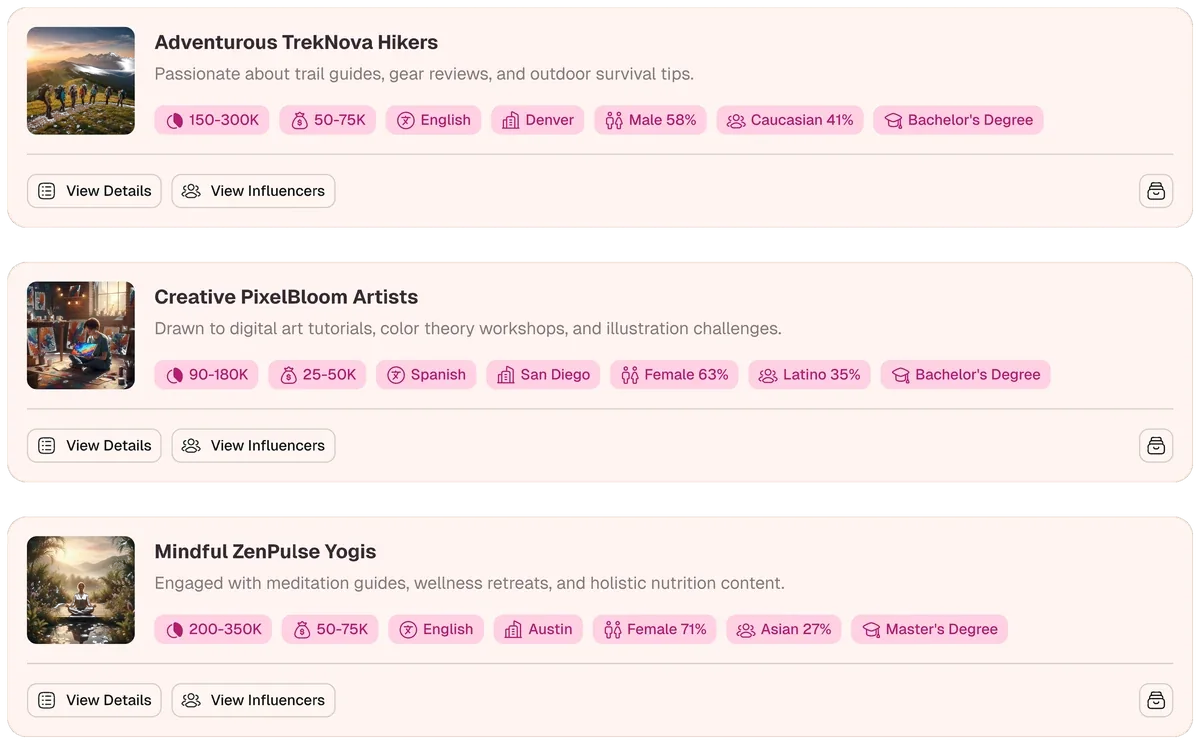
All four are ways of estimating what a campaign will return before you spend. Lickly forecasts that outcome before the money moves and shows the reasoning behind it, so your shortlist arrives with an expected return attached rather than a set of profiles you have to price yourself.
While the campaign is live
These four exist to catch problems early enough to fix them. You still have budget to move, posts to boost and briefs to rewrite for the creators who have not published yet.
5. Frequency
Reach counts individual people who saw the content. Impressions count how many times it was served, including repeat views by the same person. Frequency shows the average number of impressions delivered per person reached.
Frequency = Impressions / Reach
For campaigns focused on reaching as many new people as possible, a lower frequency generally means more of your impressions are going to new people rather than people who have already seen the content. There is no universal ideal frequency, so read it alongside reach growth and your campaign objective. If frequency keeps rising while reach has stopped growing, additional spend may be producing repetition rather than incremental reach.
Decides whether to extend paid support behind a post, cap frequency or move budget elsewhere.
6. Campaign engagement rate
Campaign engagement rate is how the content you paid for actually performed, measured against the people it reached rather than the creator's follower count.
Campaign engagement rate = Total engagements / Reach × 100
Use reach here, not followers. Once a post is live, reach gives you the number of people who had the opportunity to engage.
Then break total engagement down by action. Likes, comments, saves and shares all count toward the total rate, but they do not necessarily mean the same thing. One post may generate mostly likes, while another produces fewer total engagements but a larger share of saves and shares. That breakdown helps explain what kind of engagement each post is generating.
Compare the result with the creator's own recent performance rather than relying only on the campaign average.
Decides which post to amplify and which creator may be worth rebooking.
7. Click-through rate
Click-through rate is the percentage of impressions that generated a click to your site.
Click-through rate = Clicks / Impressions × 100
Read CTR against the placement rather than the creator alone. A story link sticker and a link in bio behave differently, so story and feed CTRs are not directly comparable. A weak CTR alongside strong saves or shares can suggest that the content is resonating but the call to action or link placement is not. Look at both the creative response and the path to click before deciding what needs to change.
Decides whether to change the call to action, the link placement or the landing page while the campaign is still running.
8. Cost per engagement
Cost per engagement is what each interaction cost you across everything you spent.
Cost per engagement = Total campaign cost / Total engagements
Use it to rank creators against each other inside the same campaign, where the offer, timing and creative direction are held constant. Across campaigns it means little, because a launch and an always-on push generate engagement at different rates. It earns its place in the mid-campaign budget conversation, when two creators deliver similar reach at very different costs per interaction.
Decides where the remaining budget goes while there is still budget left to move.
After the campaign closes
These four cannot change the campaign they describe. What they change is the next one, and whether there is budget for it.
9. Conversion rate
Conversion rate is the share of people who clicked through and then completed the action the campaign was asking for, such as purchasing or signing up.
Conversion rate = Conversions / Clicks × 100
Use clicks as the denominator when you are calculating post-click conversion rate. If 500,000 people saw the post, 5,000 clicked and 100 bought, the post-click conversion rate is 2%.
Dividing conversions by reach answers a different question: how efficiently total exposure turned into conversions. That can still be useful, but it should not be labelled as post-click conversion rate. State the denominator clearly so the two are not confused.
Decides which creators to rebook and whether the landing page, offer or post-click experience needs to change before the next campaign.
10. Cost per acquisition
Cost per acquisition is what each customer cost you across everything you spent.
Cost per acquisition = Total campaign cost / Conversions
Total cost is where many reports quietly undercount. Three things get left out: the product and shipping value of gifted units, any paid budget behind creator posts, and the internal hours spent on outreach, contracting and content review. Leaving them out makes the campaign look more efficient than it was, and makes your next budget request harder to defend when someone in finance recalculates it.
Decides whether the channel runs again at this budget, and at what size.
11. Return on investment
Return on investment measures what the campaign returned against its total cost. Return on ad spend (ROAS) measures attributed revenue against media spend only.
Simplified campaign ROI = (Attributed revenue − Total campaign cost) / Total campaign cost × 100
ROAS = Attributed revenue / Media spend
Because ROAS uses a narrower cost base, it can look more favorable than ROI. For a profitability-based figure, replace attributed revenue with attributable gross profit after product costs, discounts and returns. Name which calculation you are using whenever you report the result.
Two rules keep the number credible. First, earned media value is not revenue. EMV estimates what equivalent exposure may have cost to buy through paid media, so it should be reported separately from revenue or profit.
Second, separate organic creator performance from paid amplification. If the two are combined, you lose the ability to see what the creator content delivered on its own and what additional paid spend contributed.
Decides whether the channel gets budget next quarter and how that budget is split between creator fees and amplification.
12. Content asset value
Content asset value is what the campaign produced beyond the posts themselves, counted as cost avoided rather than revenue earned.
Content asset value = Usable assets × Your cost to produce an equivalent asset
Creator content gets reused in paid social, email, product pages and retail displays, but that reuse value is often left out of campaign measurement. Value it against what you last paid a studio for a comparable shoot, and only count assets you have the usage rights to run. That is a negotiation for before the contract is signed, not after the content performs.
Decides whether to pay up for extended usage rights next time, and it is often the number that saves an otherwise flat campaign in the review.
Influencer marketing KPI example: one campaign across all 12 metrics
Here is one illustrative campaign carried through all 12 KPIs. The campaign-level numbers reconcile across the example, while creator-level figures are illustrative.
A mid-market apparel brand spends $18,000 across 12 micro creators over 30 days: $15,000 in creator fees, $2,000 in paid amplification and $1,000 in product and shipping. Media spend is $17,000, total campaign cost is $18,000. The campaign delivers 780,000 impressions to 520,000 people, at an average order value of $95 and a gross margin of 55%.
| # | KPI | Calculation | Result | What it told us |
|---|---|---|---|---|
| 1 | Engagement rate | Roster median on followers | 4.2% | Two creators below 2% were cut at shortlist |
| 2 | CPM | 18,000 / 780,000 × 1,000 | $23.08 | Two creators above $40 were renegotiated before signing |
| 3 | Audience overlap rate | Shared followers between two shortlisted creators | 40% | One of the pair was swapped before booking |
| 4 | Relevant reach | 520,000 × 62% | 322,400 | Just under two thirds of the reach was the target buyer |
| 5 | Frequency | 780,000 / 520,000 | 1.5 | Low repetition; additional paid support could be tested while monitoring reach growth |
| 6 | Campaign engagement rate | 26,000 / 520,000 × 100 | 5.0% | Saves and shares were 36% of the total, so three posts got paid support |
| 7 | Click-through rate | 7,800 / 780,000 × 100 | 1.0% | Stories outperformed feed posts on clicks |
| 8 | Cost per engagement | 18,000 / 26,000 | $0.69 | Budget moved to the top four creators in week two |
| 9 | Conversion rate | 156 / 7,800 × 100 | 2.0% | One creator at 4.8%, four below 1% |
| 10 | Cost per acquisition | 18,000 / 156 | $115 | Above target, and the reason for the review |
| 11 | Return on investment | (14,820 − 18,000) / 18,000 × 100 | −18% | ROAS of 0.87 on $17,000 media spend |
| 12 | Content asset value | 34 × $400 | $13,600 | Adds $13,600 in separately reported production value |
The campaign was strong enough to optimize, but not strong enough to scale as-is. Frequency was 1.5, indicating relatively little repeated exposure in this campaign, while 62% of total reach matched the target audience and a 5% engagement rate identified several posts worth supporting. But that engagement translated into a 1% click-through rate, 156 conversions and $14,820 in attributed revenue against $18,000 in campaign cost. The next decision would be to keep the creators driving the strongest conversion rates, cut or renegotiate the weakest performers, and test the offer and landing experience before increasing budget. The $13,600 in reusable content adds meaningful value, but it should be considered separately from the campaign's direct revenue performance.
How to track and analyze influencer marketing KPIs
Decide where the numbers will live before you sign anyone
Most teams assemble their tracking after the campaign starts, which is why the first one is always the campaign with holes in it. Reach and audience data sit in the creator's account, clicks sit in your analytics, orders sit in your store and spend sits in a spreadsheet, and several of those cannot be recovered after the fact.
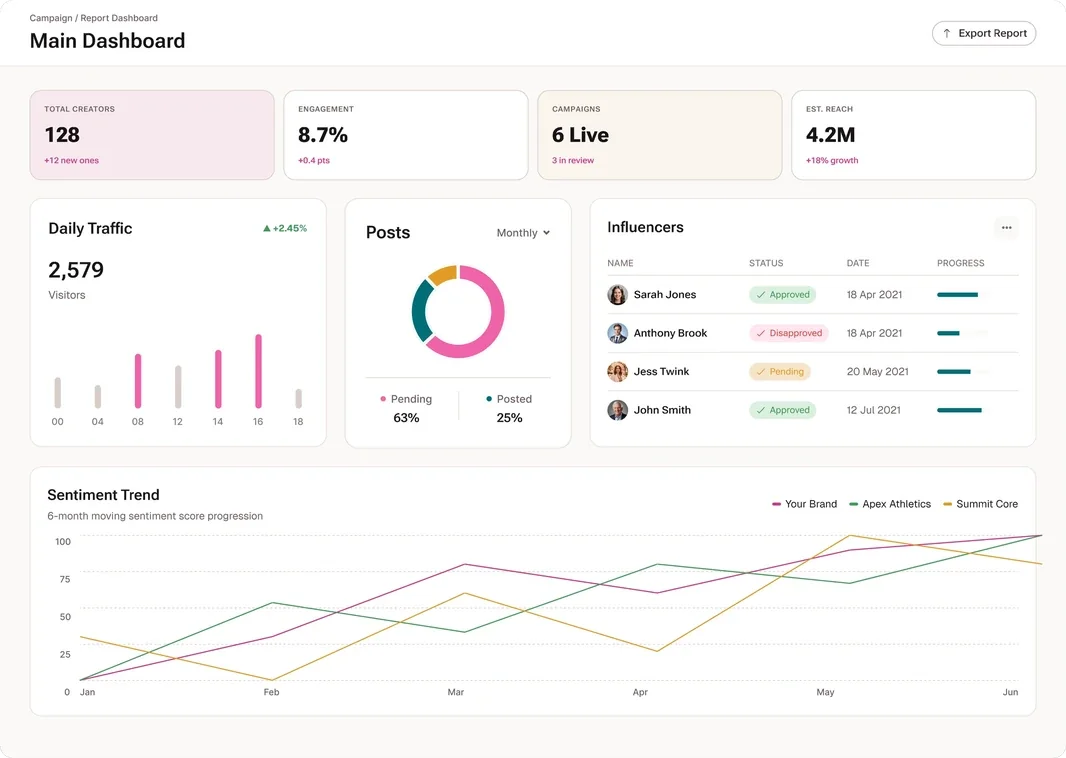
Lickly's measure and optimize layer brings them into one view and ties each result back to the audience, creator and budget decision behind it. Because every recommendation carried a forecast, you can see whether a creator performed as predicted rather than only what happened, which is the comparison that tells you what to change next time.
Set up tracking that survives the campaign
A UTM convention you never break. Keep utm_medium=influencer fixed on every link. Source is the platform, campaign is the campaign, content is the creator handle plus the asset.
yourstore.com/collections/spring?utm_source=instagram&utm_medium=influencer&utm_campaign=ss26-launch&utm_content=janedoe-reel1
One discount code per creator, and no competing promo. Codes can capture buyers who saw the content on one device and purchased later on another. A competing site-wide promotion can distort attribution because shoppers may use whichever offer is better, making it harder to connect the purchase back to the creator.
A written deduplication rule. Orders carrying both a code and a UTM get counted twice unless you pick one to win before launch. Code winning is the more defensible default.
A stated attribution window. Seven days from click is a reasonable start. Lengthen it for a longer purchase cycle, then keep it constant so the comparisons hold.
Insights sharing in the contract. Reach and audience data belong to the creator, so the influencer brief is where you ask for them.
Analyze while the campaign is running
Check weekly rather than waiting until the campaign ends. Three questions cover most of it: which creator is furthest from their own recent median, where is the cheapest engagement coming from, and is reach still climbing? Monitor conversion rate and cost per acquisition by creator as the campaign runs, but avoid acting on them until there is enough volume and the attribution window has had time to mature.
Influencer marketing KPI FAQs
What are the most important influencer marketing KPIs?
The most important influencer marketing KPIs are the ones tied to a decision you can still make. Common examples include relevant reach and cost per thousand impressions (CPM) before budget is committed, engagement rate and click-through rate while a campaign is live, and cost per acquisition (CPA) after it closes. The right primary KPI depends on the campaign objective and model.
What is a good engagement rate for influencer marketing?
There is no defensible universal benchmark for influencer marketing engagement rate. Published figures use different denominators and count different actions as engagements, so they are not always comparable. Build a baseline from your own recent campaigns, state whether you calculated engagement rate using followers or reach, and compare each creator against their own recent performance.
What is the difference between reach and impressions?
Reach counts the individual people who saw a post. Impressions count how many times it was served, including repeat views by the same person, so impressions are usually equal to or higher than reach. Impressions divided by reach gives frequency, which shows how often the average person was exposed to the content.
How many KPIs should you track per campaign?
Track one primary influencer marketing KPI per campaign plus two or three supporting metrics. The primary KPI determines whether the campaign achieved its objective. The supporting metrics help explain why it performed the way it did. If too many metrics are treated as equally important, it becomes harder to know which result should actually drive a decision.
How do you track influencer marketing conversions?
Track influencer marketing conversions with a unique discount code and UTM link for each creator. Keep utm_medium=influencer consistent and use utm_content to identify the creator and asset. Decide before launch how to handle orders that contain both a code and a tracked link so the same conversion is not counted twice, and state the attribution window in every report.
How do you calculate influencer marketing ROI?
A simplified influencer marketing ROI formula is: (attributed revenue − total campaign cost) / total campaign cost × 100. Total campaign cost should include creator fees, gifted product, paid amplification and relevant internal costs. For a profitability-based view, use attributable gross profit instead of revenue. Return on ad spend (ROAS) measures attributed revenue against media spend only, so the two should be reported separately.